LONG-TERM CHANGE IN FORESTS
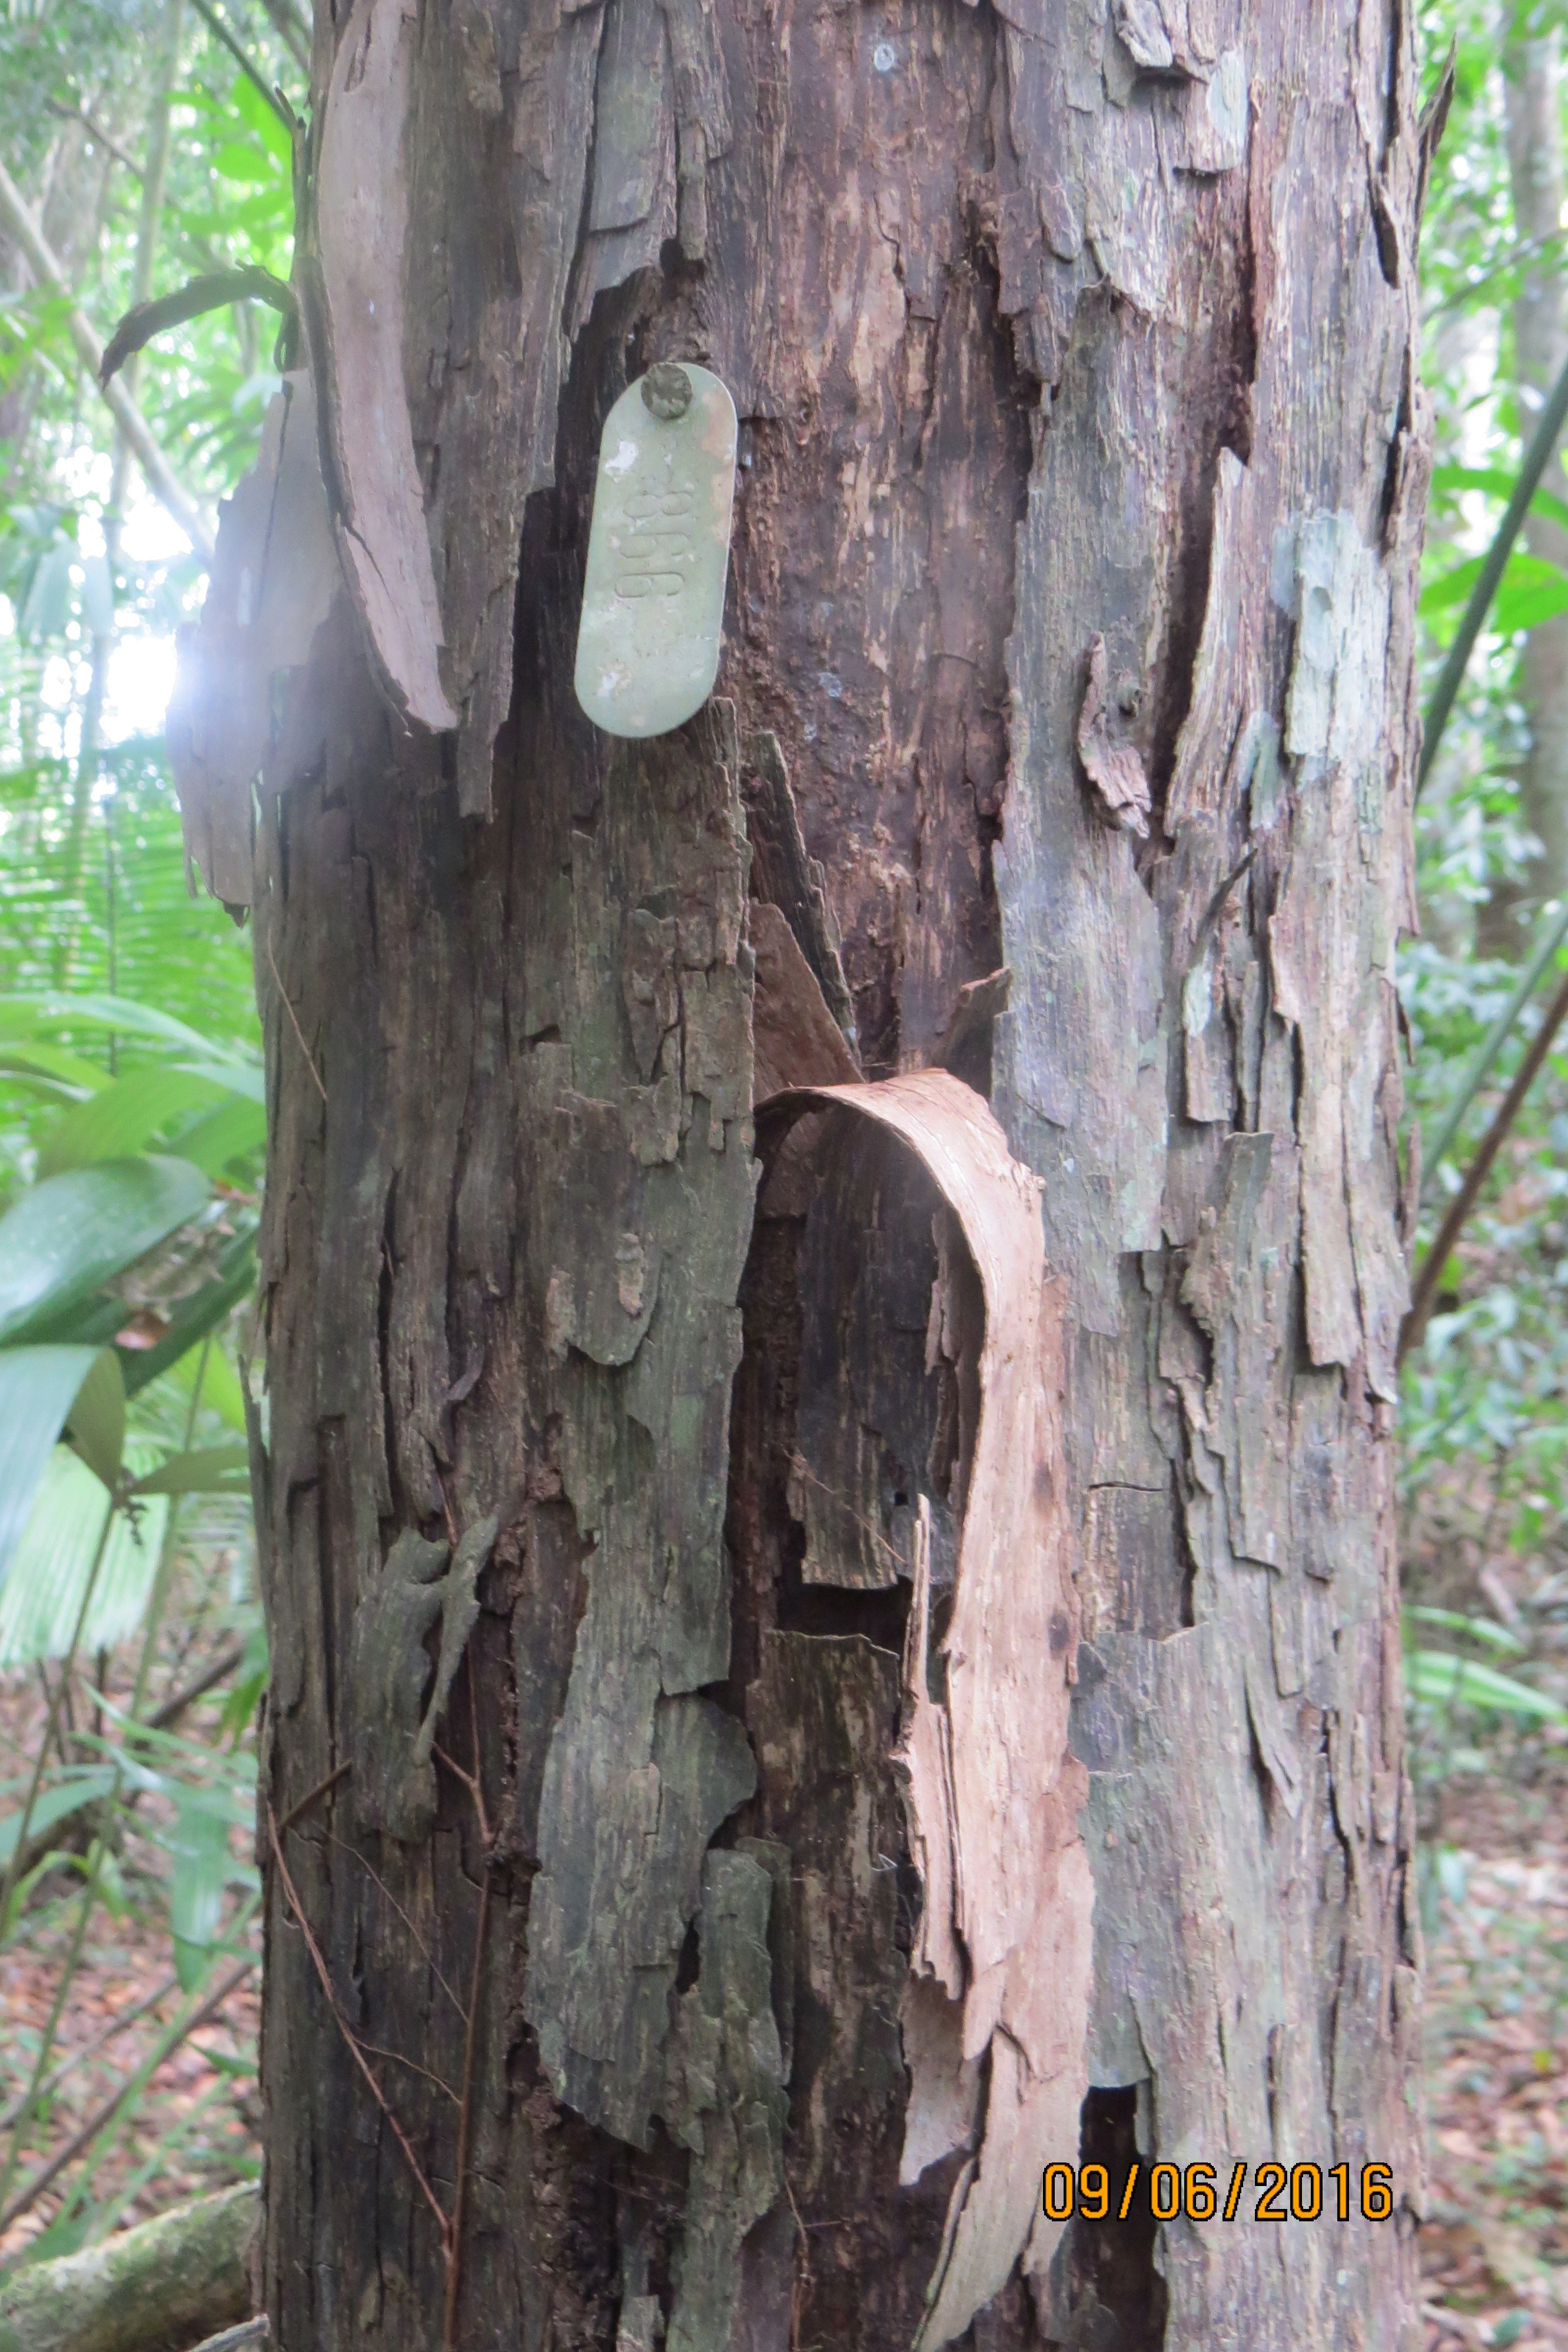
Goals and methods – A goal of this research is to understand how forests of the Rio Bravo Conservation and Management Area (RBCMA) are changing. That will help us predict the future state of the forests, for conservation and management purposes. In 1991 we established four 1-hectare plots in old-growth forest in the RBCMA. Each plot is located at a different point along the topographic or soil gradient, including dry hill top; lower, moister slopes; deep, well-drained soil; and riparian (bordering river) sites. All trees ≥10 cm DBH (see text) were identified, mapped, measured for DBH, and marked with a tag uniquely numbered for each tree. In each plot we tagged, mapped, measured DBH (diameter at breast height), and identified to species all self-supporting, woody stems ≥ 10 cm DBH. We re-censused the plots in 2015-2017, to record recruitment of new stems to ≥ 10 cm DBH, mortality of previously recorded stems, and diameters of surviving stems.
These data will tell us how the species composition of trees is changing and how fast trees are growing. We also are studying smaller stems, between 1.0 and 10 cm DBH, in order to characterize the forest understory and look at potential regeneration indicated by the presence of saplings and pole-sized trees of different tree species. In addition we record data on epiphytes, lianas, and juvenile palms. For information on the forest types we study see pages Environment and vegetation and Vegetation mosaic, remotely-sensed images. Summary results are given in the table below.

Results – A comparison of tree communities in four 1-hectare plots in the Rio Bravo Conservation and Management Area, Belize, is shown in the table below. Note the great range in values, indicating how different the forest types are in composition, productivity (growth), and dynamics (mortality). The similarity results indicate that there were two plots that, among the list of all species occurring in at least one of the two plots, only 23% occurred in both plots. By contrast there was 50% co-occurrence of species between another pair of plots. The mortality data show that mortality rate was more than twice as high in one plot as in another (2.2% vs. 1.o% per year) over the study period. As noted, the data came from old-growth forest plots; thus the differences among plots were not due to differences in forest age among plots.
|
Measure |
Range among four 1-ha plots (stems ≥10 cm DBH) |
|
Stem density1 |
380-706 ha-1 |
|
Species number2 |
58-81 ha-1 |
|
Species similarity between plots3 |
23-50% |
|
Diameter growth4 |
1.6-1.9 mm yr-1 tree-1 |
|
Mortality |
1.0-2.2% of all stems ha-1 yr-1 |
1 Range of stem densities among the four plots over both censuses for all plots.
2 Range among the cumulative numbers of species recorded in each plot at both census dates. Thus, for a given plot, the number at either one of the censuses was lower, because some species were absent at one of the censuses.
3 Based on simple presence-absence of cumulative species composition (footnote 2) in the plots, not on species abundances.
4 Range in average growth per stem, among the four plots between the census dates (from 1991 to 2015-2017).
